Many organisations undertaking month-end reporting do not have the necessary data available from a single source. Manual extraction, checks and combination of data, even before any analysis, is labour-intensive and prone to user error, involving processes such as:
The biggest issue is the lack of readily available and automatically updated data from a single source, and Power BI can fill that gap.
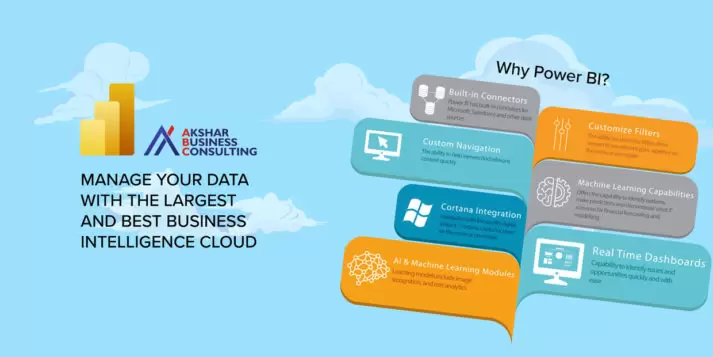
Power BI is a Microsoft business analytics platform for various cloud-based apps and services, designed for both simple and complex data input and analysis.
A user-friendly interface can help businesses gain the best data-driven information from a variety of sources, through interactive visualisations and business intelligence capabilities to creating reports and dashboards.
Its greatest advantage as a business intelligence platform is that it is designed for non-technical business users. As it is relatively similar in look and feel to Excel, training is minimised. It can work well as a self-service tool for anyone in the business to gather, assess and distribute data and insights. However, it is far more powerful than its spreadsheet counterpart.
Power BI pulls data together from your specified range of database and cloud-based data sources – from Excel to apps – and processes this data into clear and valuable insights into a business’ position and progress. Features and advantages include:
Power BI is known as an extract, transform, load (ETL) tool:
This makes it perfect for month end reporting, as it allows you to build a complete set of financial statements (including P&L, balance sheet and cashflow) and fully automate your month end reporting process.
Best of all, once set up, the automatically updated data means, pulling subsequent reports will be far quicker and more efficient than previously, as you can start populating the report straight away with just a few ‘drag and drops’ or ‘point and clicks’.
Furthermore, these saved processes can be shared with co-workers to improve flexibility and advance best practice across the organisation.
Other advantages include:
Power BI can produce high-quality reports that display financial information of your company in dynamic executive dashboards for administrators or managers. This will give management additional insight into how departments are doing.
As a cloud-based application, authorised users can access features from nearly anywhere. It offers a real-time 360-degree perspective of your business data and offers interactive reporting.
With Power BI, you can transform both the efficiency and scope of your month-end reporting, including:
Having an expert help you ensure your finance function is optimised, enabling you to focus on supping the leadership teams and drive strategic success.
Talk to us today about our range of services to help you build and deliver a more cohesive, value-added strategy for your finance function, at the very centre of your organisation.
Start Your Finance Transformation Journey With
One Simple Step!